Data reveals the fascination of the forest and shows us how we can preserve it.
International Earth Day is used annually to raise awareness and appreciation for nature’s diversity and beauty. With the Tree Potential Project, Microsoft wants to contribute to this by making data collected from forests in the United States available to the public.
Together with Tea & Water Ltd. and SilviaTerra LLC, we have created an online tool to innovatively visualize and explore tree populations:
https://prefrontalcortex.de/tree-potential/
Every forest has a story. It is often as amazing as it is individual and can be defined by different tree species, creatures, raw materials or climatic conditions. The Tree Potential Project aims to tell these stories and shows us how we as a society can contribute to the preservation of the forest and its special characteristics.
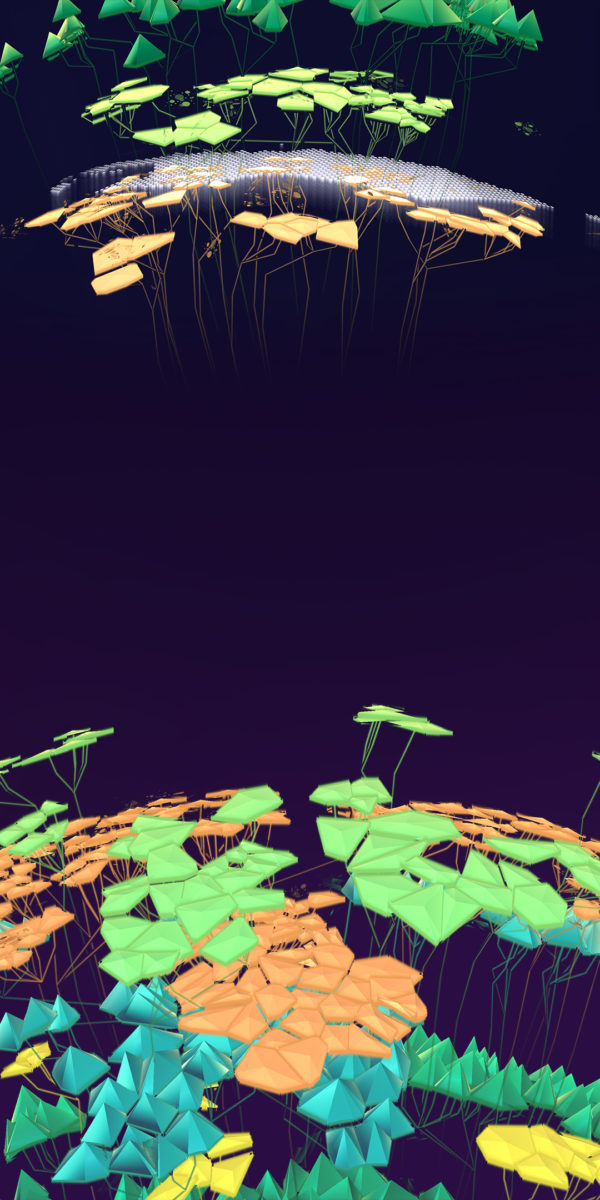
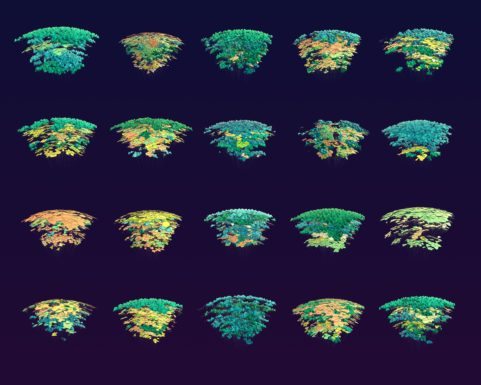
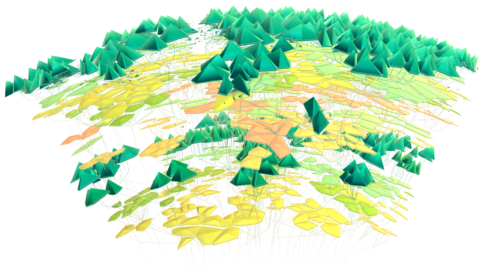
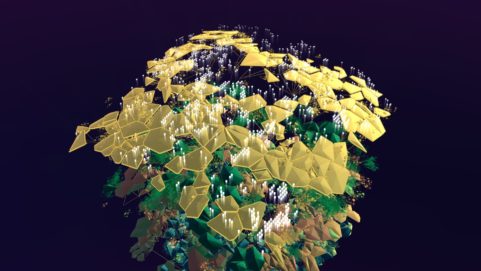
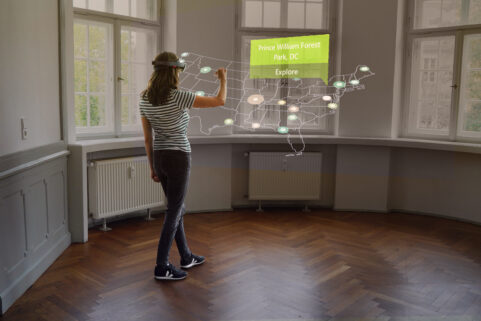
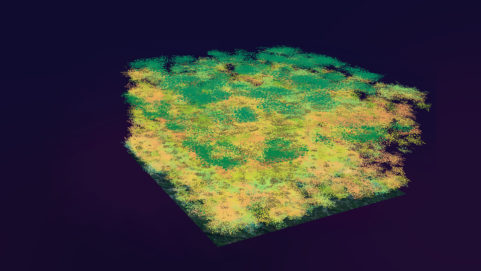
Select one of the 20 available National Parks on an interactive map and get detailed information about the local tree species, their percentage distribution and average growth height as well as trunk circumference. In addition, each forest contains a “story layer” that visualizes the area’s specific characteristics, such as a high carbon content or the habitat of a rare bat species. Together, this information results in a modern data display that enables exciting navigation through the layers of the forest.
In the end of each forest page the user also has the opportunity, with the support of Microsoft, to donate to the non-profit nature preservation organisation The Nature Conservancy. This is to ensure that the stories of the forests are not only told, but can also survive.
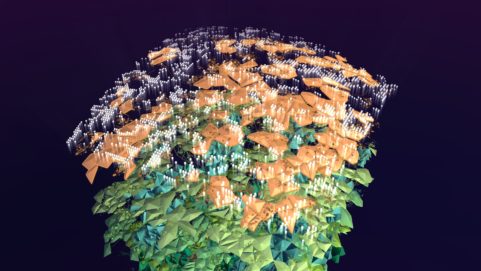
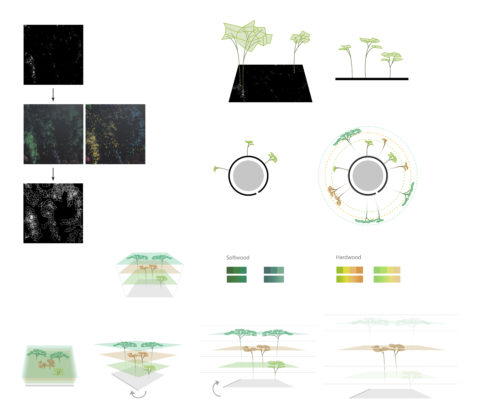
The visualization is based on satellite data, collected and evaluated by SilviaTerra LLC using Microsoft AI, which is used to manage forestry operations and conserve forest resources. We process this data to create a multi-layered sculpture that combines the fascination of Big Data with generative design. In addition to appealing visuals, we paid particular attention to an efficient and performant presentation in the web and a responsive design to ensure easy access for as many users as possible.
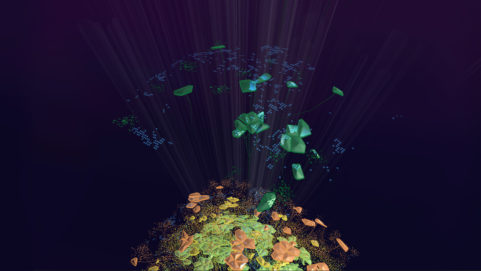
Augmented reality data visualization
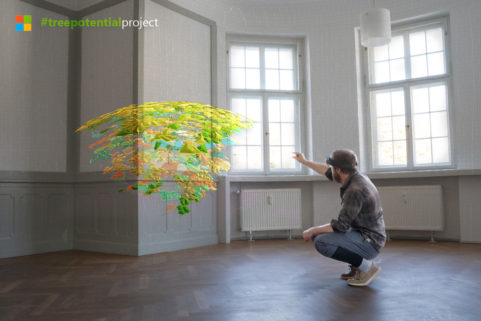
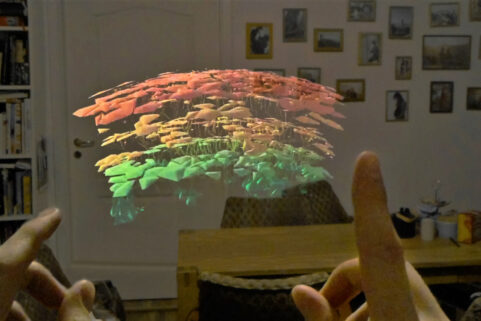
Towards the end of the project period, we did some experiments on how our abstract representation of tree populations in North America could be displayed in other output formats – the result was a prototype for Microsoft Hololens, where you can bring the data visualization into your own living room and control it intuitively using hand gestures.
Behind the scenes / Process
Tools Unity3D
PeriodDecember 2018 - April 2019
ClientTea & Water Ltd.
TeamChristian Freitag, Felix Herbst, Paul Kirsten, Timo Pointke, Thi Binh Minh Nguyen, Stephan Kloß
CooperationMicrosoft, SilviaTerra LLC


